Data Matters: Using Chronic Absence to Accelerate Action for Student Success, by Hedy N. Chang, Lauren Bauer and Vaughan Byrnes, September 2018. *Revised December 2018.
This report provides a national and state analysis of how many schools face high levels of chronic absence and discusses the implications for state and local action.
Nearly 8 million students, in every state and at every grade level, missed three or more weeks of school in 2015-2016, according to data released by the U.S. Department of Education’s Office for Civil Rights. Based on the OCR data, the analysis compares differences in school chronic absence levels from the 2013-14 and 2015-16 school years, while showing the connection between chronic absence levels and demographics. The report shares tools for unpacking the causes of chronic absence and provides recommendations for action.
State data reports for all 50 states and the District of Columbia, and an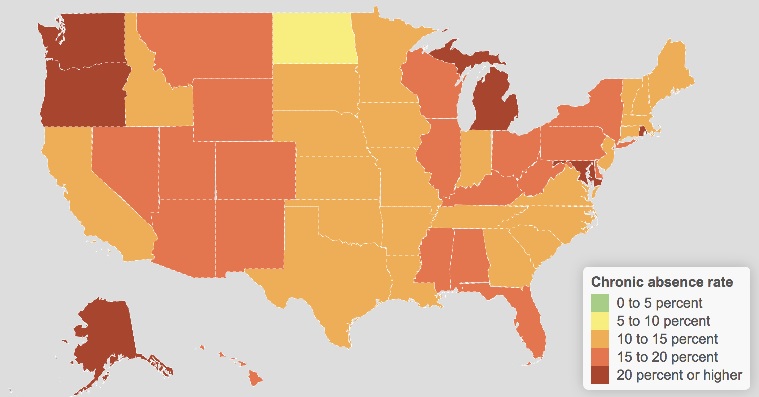 interactive map from The Hamilton Project at the Brookings Institution allows anyone – from parents to policymakers – to explore the scale of the chronic absence problem documented in the 2015-16 school year data at multiple levels: school, district, state and country.
Note:
*This report, the interactive map from The Hamilton Project, and the state data reports have been revised to reflect updated data from Prince George’s County for the 2015-16 school year. The incorrect data was the result of an honest error on the part of Prince George’s County and not an attempt to manipulate the statistics. Equally important, the error had national significance. Because of the large size of the Prince George’s County, the error changed national figures for African-American youth and had an impact on Maryland’s overall ranking.
Read a blog post from the report authors about the reporting error, The value of public scrutiny: Lessons learned after the release of Data Matters.
Please scroll down this page to find the state data reports for all 50 states and D.C., and tables that rank states.
Download messaging materials, and a social media image, to spread the word about Data Matters.
To best understand how many and which schools are most affected by chronic absence, data must be examined at the state and local levels. Gaining a deeper understanding of the size and scale of the problem is critical to determining how best to align resources in order to prevent and address chronic absence.
Click here to download national tables with state rankings.
Click on your state below to download an analysis of school level chronic absence.