To best understand how many and which schools are most affected by chronic absence, data must be examined at the state and local levels. Gaining a deeper understanding of the concentration and severity of absenteeism also sheds light on the level of support needed to prevent and address chronic absence.
Click on a state button below to download an analysis of school level chronic absence. We include a set of data highlights for each state for school year 2021-22. Click here to see the national pattern as a basis for comparison.
(Idaho and Washington are not included because of inconsistencies detected in the federal data.)
The data is released as part of Turning Back the Tide: The Critical Role of States In Reducing Chronic Absenteeism, which includes action steps for states.
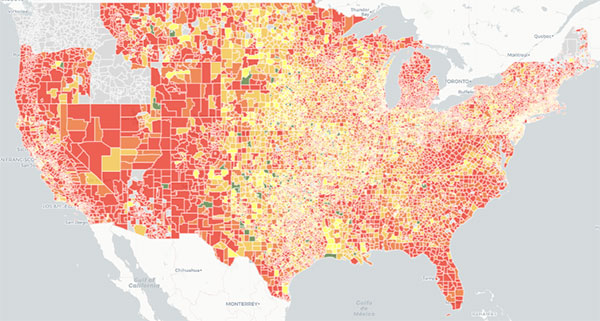
Everyone Graduates Center at Johns Hopkins School of Education developed an interactive map showing district level chronic absence rates in every state. Use the map to scrutinize which districts are struggling with high and extreme chronic absence and identify successful efforts.