Too often, parents, students and sometimes teachers don’t realize how quickly absences, excused as well as unexcused, can add up to academic trouble. At the same time principals, district leaders and community members often don’t know if chronic absence is a significant problem in local schools.
Research shows that missing as little as 2-3 days every month is considered chronic absence, and can translate into third graders unable to master reading, sixth graders failing courses and ultimately, teens dropping out of high school.
We’ve found that the best way to identify students with poor attendance is to calculate the data that schools are already collecting. Analyzing local attendance data can help determine chronic absence levels, and show patterns across students and schools. This is a good first step towards designing strategies to help students get to class every day possible.
Analyzing district-level data also can highlight schools that are making good progress. What’s happening in these schools that serve similar populations of students, but are achieving better-than-average results? By looking into what works in these schools, you can identify effective practices that others could replicate.
We’ve partnered with Applied Survey Research and developed some tools to simplify the process. Please share with your districts, schools and communities. The self-calculating spreadsheets for school districts are called the District Attendance Tracking Tools (DATTs). These free tools are especially effective for smaller districts with more limited data capacity.
The companion tools are the School Attendance Tracking Tools (SATTs), which provide school-level analysis down to the individual student level.
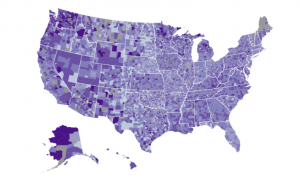
The release of national chronic absence data from the US Department of Education’s Office for Civil Rights (OCR) shows chronic absence data for most schools in every district in the country. The heat map (also on this page) developed by ED for its web based data story provides a quick view of the issue in each district. The DATTs and SATTs can facilitate a deeper analysis of ED’s Civil Rights Data Collection (CRDC) for your district or school.
- To download the tools and handbooks, please register here.
- Click here to download our handout about the DATT and SATT.
- Have questions about the tools? email help@attendanceworks.org
- Click here to find our more about OCR’s national chronic absence data, including a link to Attendance Works’ guide to help filter the CRDC data for your state.
- We looked at how state and local innovators are already using chronic absence analyses to galvanize action in our May 17, 2016 webinar. If you missed Using Data to Drive Action: Portraits of Chronic Absence, you can find the webinar recording and presentation slides here.