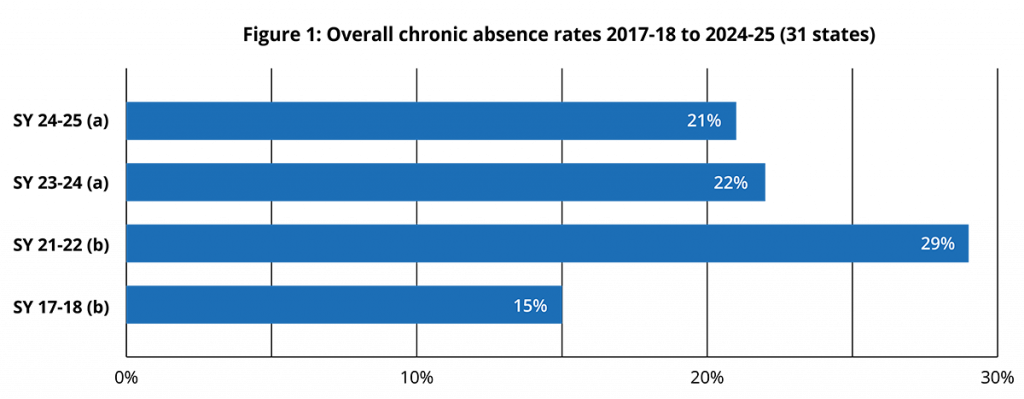
Nearly five years after the onset of the Covid-19 pandemic, more than 20% of students are still chronically absent, meaning they miss 10% or nearly a month of school. Data from 31 states for the 2024-25 school year show that overall rates of chronic absence have improved nationwide. Yet it is still higher than prior to the pandemic. Absenteeism remains a major educational challenge that is undermining student achievement and well-being. (See figure 1).
But overall levels of chronic absence do not paint the full picture. This analysis examines the levels of chronic absence experienced in schools. This matters because when a large number of students (20% or more) in a school are chronically absent, it has ripple effects. The churn in the classroom makes it more difficult for teachers to teach and affects the learning experience of all students. When students are in a classroom with chronically absent peers in the beginning of the year, they are more likely to become chronically absent themselves by the end of the year.
An elevated level of chronic absence in a school is a sign that the school may require adopting a more comprehensive approach and a more intensive level of support. Very high numbers of chronically absent students are beyond the capacity of a single social worker or counselor to address, which is a call for schools to consider their entire system.
After sharing how many schools are still struggling with 20% or higher rates of chronic absence, this analysis shows how these patterns can vary by state and how reducing elevated school-levels of chronic absence remains within our reach.
Chronic absence still too high in too many schools
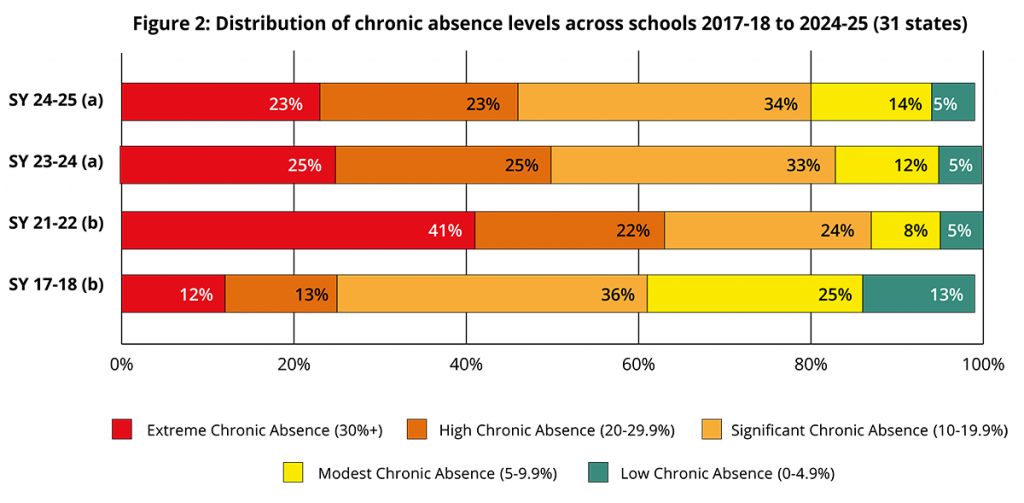
The most recent data (2024-25), obtained from 31 states, shows that chronic absence rates remain far too high among U.S. schools. Nearly half (46%) of all schools in these states continue to have high (20-29%) or extreme (30% +) rates of chronic absence. The encouraging news is that this is a continued 3% decrease from 2023-24 and a substantial 21% decrease from 2021-22, when federal data for all states showed that nearly two-thirds of schools had 20% or more of their students chronically absent. Prior to the pandemic in 2017-18, only about a quarter of all schools had such high levels of chronic absence.
Looking at it in a different way, the percent of schools experiencing extreme levels of chronic absence (30%+) has almost been cut in half from 41% in 2021-22 to 23% in 2024-25. While all of these reductions are positive indicators, the percentage of schools with high and extreme chronic absence is still extremely elevated. (See figure 2).
High and extreme levels of chronic absence in schools vary across states
In nearly all states of the states for which 2024-25 data was available, states reported that school-levels of chronic absence remain higher than the level found pre-pandemic using federal data. And, while there is variation across the states, nearly all saw noticeable reductions in the percent of schools with high or extreme chronic absence from 2021-22 to 2024-25. Most, however, still have from 15 to more than 30 percentage points more schools with either high and extreme absence than in 2017-18. View a spreadsheet with state-by-state and national chronic absence rates.
School chronic absence levels especially high in higher poverty communities
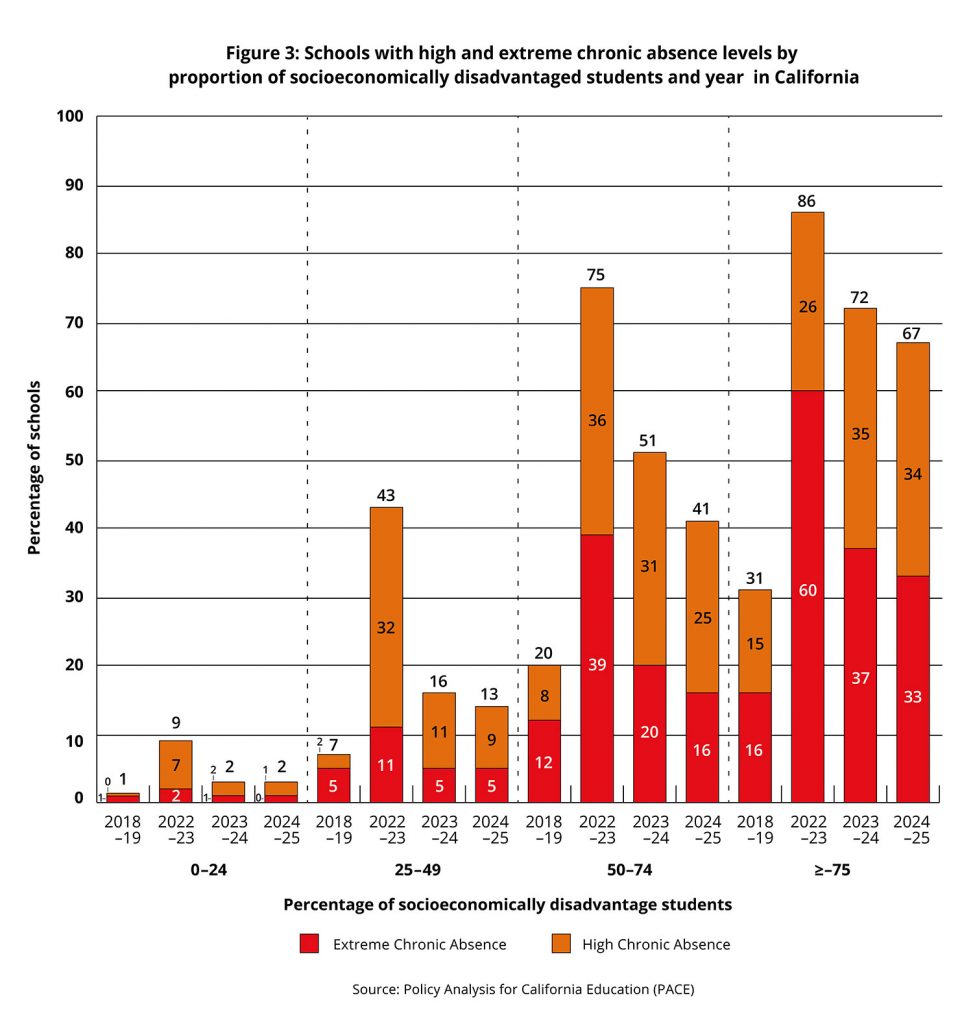
AEI’s Return to Learn Tracker shows how higher poverty communities experienced higher levels of chronic absence both before and during the pandemic. Data from California suggest that higher poverty communities have an even more difficult time recovering from high and extreme levels of chronic absence post pandemic. Unpacking California’s Chronic Absence Crisis Through 2024-25: Eight Key Facts from PACE shows that high and extreme levels of chronic absence in California have barely decreased among the schools where the vast majority of students are considered socio-economically disadvantaged. Unfortunately, chronic absence can be especially harmful for students struggling with poverty, who are more likely to face multiple systemic barriers to regular attendance and have fewer resources to make up for lost learning opportunities in the classroom. (See figure 3.)
Bright spots: Reducing elevated school-levels of chronic absence is within our reach
Such elevated levels of chronic absence can overwhelm school staff, and negatively affect teaching and learning for all students, not just for those who aren’t in school. Addressing such high levels of chronic absence, however, is possible. It requires going beyond a single staff person or single strategy to engage the whole school. Especially in schools serving large numbers of students struggling with poverty, it requires enlisting the support of community partners in a comprehensive approach that addresses the underlying barriers to getting to school. Equally important, solutions require constantly using quantitative and qualitative data to assess what is working and what needs to be changed in order to motivate students to attend and engage while overcoming underlying challenges.
Hall’s Cross Roads Elementary School
Consider, for example, the successful efforts of Hall’s Cross Roads Elementary School in Hanford County, Maryland. Serving 440 children, pre-K through 5th grade, most (90%) of its students are eligible for free and reduced-price lunch. It has successfully reduced its chronic absence rate to 14.5% after it rose from 21% to 48% during the pandemic. According to school leaders, the key has been creating and communicating to staff and families a vision where attendance is seen as a top priority, while also assessing and modifying current resources and programming if they weren’t having the desired effect. This involves continuously analyzing data and measuring impact, and creating a culture of high expectations and shared responsibility. Working together, for example, the principal and community schools coordinator realized that their Rise and Shine program, designed to provide a bus ride to students who were chronically absent wasn’t achieving its goal. The presence of the bus incentivized poor attendance among students eager to be eligible for the ride, and didn’t address the challenges facing the students who walked to school and were more likely to be chronically absent. At the same time, professional development for teachers was making student engagement more difficult because it was taking teachers away from the classroom at critical times. Read our bright spot story to learn how this school turned the situation around.
Camelback High School
Another powerful example of dramatically improved attendance occurred at Camelback High School in Phoenix, Arizona. Serving over 2,100 ethnically diverse students in grades 9-12, this school reduced chronic absence from 46% in the 2021-22 school year to 25% in 2023-24. Key strategies included using actionable data to prompt timely and caring communications from teachers to families, building trusting relationships, and new Career and Technical Education offerings to boost academic engagement. The most essential ingredient has been a deep and lasting investment in ensuring that students are on track for success starting in the 9th grade. Camelback has grouped its incoming ninth graders into smaller groups who share the same math, science and English teacher. Freshmen “success teams,” include a counselor, house coordinator, administrator and the three content teachers. The team meets weekly and is aligned to provide wraparound support to students. Find out more in this bright spot story.
Both bright spot stories illustrate that a comprehensive, multi-strategy response is needed to move the needle on school-level attendance. A forthcoming report by the Everyone Graduates Center analyzing survey results from a nationally representative sample of school principals supports this approach. The survey indicates that principals in schools which implemented five or more evidence-based attendance improvement strategies were much more likely to report significant improvements in attendance when compared with schools which reported only using one or two strategies. The survey results also suggest that it is important for schools to tailor the strategies to the main reasons students in their community are absent. Just because a strategy has evidence of impact does not mean it is the right one for all schools. Doing a deep dive through surveys, focus groups or interviews into why students are not attending, however, was the strategy least employed by principals.
Sustained change requires systemic action
While schools are where the rubber hits the road, sustained change that has widescale impact requires districts taking a systemic approach. Stay tuned for a blog article discussing lessons learned from district-level “bounce back” bright spots. These “bounce back districts” saw a significant increase in chronic absence from 2019 to 2022, but have since returned to near pre-pandemic rates.
Methodology
This analysis draws upon both state and federal data in order to take stock of the current situation and compare it to historical trends. Federal data was the first widely available national chronic absence data source. It also consistently defines students as chronically absent if they were enrolled at least 10 days and missed 10% with days defined as missing .5 of a day. Federal data has typically been released every two years and is currently even further delayed as a result of reduced staffing at the federal level.
State data, which only became widely available in recent years, is now published at least annually in most states. The data for this brief draws from the state data from 31 states which had data available for the 2024-25 school year and released it for every school in their state. To ensure consistency, we used the data from the same 31 states to calculate national levels of chronic absence. These national figures show similar but slightly lower rates of chronic absence than when it is calculated based upon all available state data.
However, it is also important to note that state data is less consistently defined since states can set their own rules. Some states, for example, require students to be enrolled for a longer period of time to be included in their chronic absence counts and as a result report slightly lower levels of chronic absence. Because of this, we do not recommend comparing data across states, even as we are using it to review the results over time.
For a state-by-state view of these variations in rules around enrollment and attendance, see this table which accompanied our report, More Essential than Ever, State Taking Action to Improve Attendance.
By Hedy Chang, CEO and President, Attendance Works; Robert Balfanz, Director, Everyone Graduates Center, Johns Hopkins University; and Vaughan Byrnes, Senior Research Associate, Everyone Graduates Center, Johns Hopkins University.